Category: Statistics

Whisky in a cup of tea

Did you know that Al Capone drank whisky in a cup of tea? It might be a hoax but I heard it on a rather serious radio and I found it cool enough to mention it here. A more “serious” reason than the “cool” factor was that it provided a good introduction for the topic of this article.

Some time ago, I asked one of our fellow bloggers here what he would like to see in this blog and his answer puzzled me as he had heard that there was a link between the consumption of alcohol in the United States and of tea and that, the first one was decreasing while the second one was increasing. If you had asked it to me, I would not have come up with a link between these two as it seems completely counter intuitive.

However, I decided to pick up this challenge and to investigate this topic, which was also a perfect way to illustrate one of my latest posts in a practical way.

The first thing was to decide the scope of my data analysis. I decided to go for the three main markets for these two products: America, Europe and Asia (the fact that the sources I later found also had this segmentation is pure luck. You don’t believe me, do you?). I could have gone with several countries but after giving it much consideration, I could not find to which countries, I should compare the United States. Moreover, a focus on one single country might not have been representative of what was going on.

Knowing the geographical area, I decided to check for data.

… … …

… … …

… … …

These were my first results, as it seemed complex to find anything in a single database. I decided to split the search into alcohol and tea and since I knew where to look for tea, I thought it made it easier.

After looking on the Internet with several keywords, I found out that the available statistics on alcohol consumption were from the World Health Organisation (WHO) and expressed in terms of consumption per capita in litres of pure alcohol. Let’s put it in other words, they converted all the drinks into pure alcohol (I have no real clue how it works but the basis seemed coherent to me) and they had databases covering each year between 1961 and 2017. The earlier years were not always coherent or complete but I had a base to begin working with.

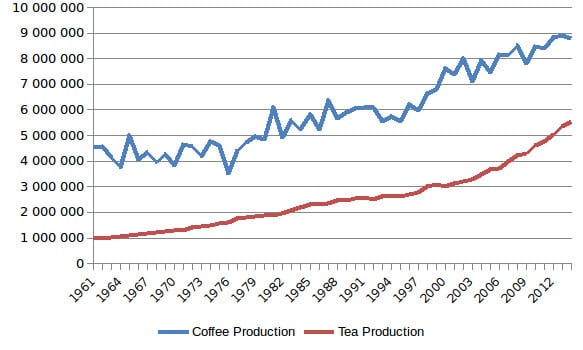
For teas, I had to answer a rather simple question: how much tea was drunk? I had access to several sets of tea related data but not a single one giving me this information.

My educated guess was that “what a country/area produced each year + what a country/area imported each year – what a country/area exported each year” was a good estimate of how much tea was available for consumption. Obviously, this is only an estimate as not all this tea is drunk each year but if you have a better idea, I am all ears.

However this was not enough as I couldn’t compare tons and litres. I needed a way to convert these available tons in litres of tea. After a lot of thought and look all around, I decided to go for 12 grams of tea per litre, which means that with 1 ton you could get 83,333 litres of tea (again if you have other figures, let me know).

The nice thing was that I had access to the same timeline as the WHO one, which made comparison and statistical analysis easier.

This is all for now but stay tuned as next time I will compare the data and try to see how they evolve over time and if there is any link between them.

Back to the future

As you might have noticed (for example here or here) I have an interest in prices of our nice little drink: tea.

I usually focus on old prices (sometimes among centuries) and I might still do that soon but another interesting thing is to focus on prices, on future prices. Don’t worry, I will not drown you into million of complex mathematical formulas or some barbaric letters like α or β but more into the minds and whereabouts of people doing this.

If you do an Internet research on this topic, you will find I am sure a lot of different things. I did it but only in English. I am sure there are other interesting findings to make in other languages such as Chinese or Japanese but since I don’t speak either, I couldn’t look in this direction, if you can and if you do, I would be interested to hear about it.

But let’s go back on our main topic.

After some research and cross references, I found several articles about price of tea and how to “predict” them in a mathematical way. However, guess what? The numbers and formulas weren’t the same. I hear you saying “how typical” and things like that.

But let’s get out of these clichés and look a bit more at what the different researchers/students worked on and how they did it.

First, some were working on Indian teas (with a further subdivision into Northern and Southern ones) and others on Ceylon ones. Obviously, if you don’t have the same geographical perimeter, you don’t get the same tea prices in the past and therefore not the same analysis.

Second, two different methods were used and both are valid. I will explain myself. In order to get models that match the past (and thus can predict the future if there aren’t too many changes in the overall conditions as mathematical models only work if “all other things being equal” (a standard sentence in this field of work), you must keep out of the system, the outliers (small mistakes or data that for one reason or another don’t fit into the general picture) and the things that mess up with the general trend. One of these things can be the season effect (which obviously is true for commodities), like for example the Christmas season is usually an important event but is not representative of the sales of the whole year and as it comes back every year, it can be discarded. On the other hand, one can make the hypothesis that the discarding of this data is a waste of efficient information (or because there is a lack of belief in the seasonality of certain things) and thus keep all the data.

With two simple explanations of the first steps when facing a lot of data, it is possible to understand why results are different from one research to another.

But how does it truly work?

OK. Let’s say that you’ve got your data (enough of it) and you cleaned it the way you want. There are several types of mathematical models that can be applied to a certain set of data to fit the past evolution and then to “predict” the future ones. This means either having the intuition or the knowledge that one might do the job (more or less) or having to test several before finding the one that suits the data you have. Earlier this was done with pen and paper but today, computers can do quickly and far more efficiently than we can, easing the task).

Random data points and their linear regression by Sewaqu

Once a model suits the data you have and you have all its values, you must check to see if the outliers you left out make any sense. In other words, is there a reason for the price dropping or increasing by 50% a peculiar month? For example tea prices could go up because the production isn’t up to what the market needs because there was flood or lack of rains or …. If you manage to find a plausible explanation for every out of place data, then it is likely that your model is adequate and that you can use it to predict the future price of tea leaves.

But obviously, it implies “all other things being equal”, which is always the tricky part and can lead to new results and a complete rework of what has been done.

And remember, Don’t worry. As long as you hit that wire with the connecting hook at precisely eighty-eight miles per hour the instant the lightning strikes the tower… everything will be fine.

Is the gap narrowing?

According to a radio emission I heard a couple of weeks ago, coffee is the second most valuable item sold in the world behind oil. When I heard that, I had to check if it is was true and compare it to similar data for tea.

But first, I have to tell you a little story. I was asked why I wanted to compare everything to tea or rather does tea people have an inferiority complex regarding to coffee? The truth is much more simple. I do drink tea and speak about it on my blog. When I heard that radio emission on coffee, I had to check it and compare it to my favourite beverage, which is something that it could be compared to. I have no inferiority complex but a deep sense of curiosity trying to determine what is the truth in what I read and I must confess that I tend here to bring everything to the main topic of the blog: tea.

After this small deviation from my point today, let’s first thank the Food and Agriculture Organisation and their databases, which allowed me to collect data from 1961 and to check it, cross it and so on.

Total export value in 1,000 $

First, it is true that coffee has a higher sales value than tea. I couldn’t find a year when this wasn’t the case.

Then I thought that perhaps tea had a higher value per ton than coffee. I did the maths to find the average price in a year and over the 52 years of my sample (1961-2013), tea had the highest sale value pro ton 27 years and coffee 25 years. Surprising? Not really because it is an average and it takes everything into account from the production for the multinationals to the more artisan crafted products. However, as you can see below, the export value of coffee is far more erratic as the one of tea, which might be linked to several things, either variation in quantity (which is not really what happened as we will see) or in the quality of the production or in the way the prices are made (there are several ways of doing that with a possibility for the price to become completely disconnected from the real life conditions).

Export value per ton in $

I then thought that perhaps not everything was accounted for as a lot of tea is not sold on the international market (between 35 and 47% of the tea production was exported in the last 10 years and between 76 and 91% of the coffee production) so I decided to check if by adding the locally consumed goods, the overall picture became different…

Total production value in the world in $

…and the answer is no.

Why? The only explanation lies in the higher production of coffee in the world. Even if the difference is decreasing, it is still a huge one. In 2013, 1.58 more tons of coffee were produced in the world as tea (8,8 millions tons against 5,56) but the gap is narrowing as it comes from an impressive ratio of 4.64 in 1962 (4,53 millions against less than a million).

Total production in the world in tons

The only question I can see from this latest chart is to know if this trend will hold on the long run and will tea production narrow the gap with the coffee one.

Rather than be a theoretical question or an ego one from a tea drinker, it is more a way of knowing the maturity of the production of each commodity, its attractiveness to newcomers, the progresses it can make in productivity (I partly answered this question in another of my blog posts).

And those are interesting questions or so do I think.

Torture the data, and it will confess to anything

My dear fellow Teatrader @thedevotea wrote a few weeks ago a post on a report about the increase in tea consumption in the world between now and 2019. His main complaint was that Australia didn’t make it to the top 20 of this list.

This is something rather unfair because there is a tea brand in this country that tries to change things out there (no name @thedevotea, no name).

When I read this post, I knew I had to write something about the report behind it.

I first looked at the tables available and wondered what was going on there until I noticed that it was all about market value and not consumption.

Now I got it.

So the overall tea market value in the whole world is going to increase in the 4 next years of a total of 32.56% (5.8% per year), with the situation being completely different from one country to another.

From a classical point of view, a market increases in value if it either:

– increases in volume while increasing/retaining its prices or not going through a huge decrease in prices,

– goes through an increase in price while keeping the same volume of sales.

An increase in volume on the tea market of a said country can mean several things. First of all, that the country population just grew or that people buy more tea or both of them at the same.

An increase in price can either mean a lack of supplies or an increase without any increase in quality (a monopoly or oligopoly situation), or with an increase in quality (new competitors coming to the market with better products, customers willing to get more for their money) leading customers to be ready to pay more for what they buy. This happens quite often when the incomes in one country rise.

The last option is a mix of both.

You can understand that the consequences of these different reasons are quite different in terms of what can be expected in the future for tea.

The situation will of course be different from one country to another.

Let’s try to do a guess on the top 20 growth rate found in the study and to categorize the different countries depending on the reasons behind their growth. Obviously, this analysis is 100% personal and subjective but it is based on my educated guess.

Since I don’t know everything about these countries so what is left blank are the topics I don’t know enough about to make an educated guess (but you can always give me the info I am lacking).

In order to try a bit more rigorous in my approach, I decided that the first two columns (increase of population and growth of average basket size) would be based on “hard” data, which means that the first one is based on the UN prospects while the second one is based on the tea consumption per capita and the position when compared to the world average.

Country Increase of population Growth of average basket size Lack of supplies Oligopoly situation Increase in quality

China

Possible because of the sheer number of inhabitants

Unlikely, competition of coffee

Unlikely unless massive change on the production side

Unlikely, due to the number of local producers

Possible, will depend on the evolution of the competition with coffee but for the same reason, potential risk of a drop in quality.

United States

Unlikely

Possible, tea is a challenger

Unlikely unless massive change on the production side

Unlikely, due to the nature of the market

Possible, will depend on the content of the average basket and the rise of a tea culture among the youngsters (see Tea with Gary)

Morocco

Likely

Unlikely, already high

Unlikely unless massive change on the production side

Sri Lanka

Likely

Likely, below world average per capita.

Unlikely unless massive change on the production side

Japan

Unlikely

Unlikely, competition of other drinks

Unlikely unless massive change on the production side

Unlikely, due to the nature of the market

Due to competition with other drinks and tea products, potential risk of a drop in quality.

Panama

Likely

Likely, below world average per capita.

Unlikely unless massive change on the production side

Bolivia

Likely

Likely, below world average per capita.

Unlikely unless massive change on the production side

Rwanda

Likely

Likely, below world average per capita.

Unlikely unless massive change on the production side

Ecuador

Likely

Likely, below world average per capita.

Unlikely unless massive change on the production side

Ethiopia

Likely

Likely, below world average per capita.

Unlikely unless massive change on the production side

South Korea

Unlikely

Possible, below world average per capita but with a possible diversification towards other drinks (developed country)

Unlikely unless massive change on the production side

Due to competition with other drinks and tea products, potential risk of a drop in quality.

Kenya

Likely

Likely, below world average per capita.

Unlikely unless massive change on the production side

Sudan

Likely

Likely, below world average per capita.

Unlikely unless massive change on the production side

Malaysia

Likely

Low probability, above world average

Unlikely unless massive change on the production side

Kyrgyzstan

Likely

Low probability, above world average

Unlikely unless massive change on the production side

Peru

Likely

Likely, below world average per capita.

Unlikely unless massive change on the production side

United Kingdom

Unlikely

Unlikely, already among the world top tea drinkers per capita

Unlikely unless massive change on the production side

Unlikely, due to the nature of the market

Unlikely due to the consumption habits or only at the margin

Vietnam

Likely

Unlikely unless massive change on the production side

Mongolia

Likely

Low probability, above world average

Unlikely unless massive change on the production side

Colombia

Likely

Likely, below world average per capita.

Unlikely unless massive change on the production side

As you can see, I don’t know enough to make a credible review of the 20 countries and I will let you conclude why these countries should (according to the original market analysis) experiment a rise in their tea market. But according to Socrates and the Oracle of Delphi, knowing that you know nothing is the beginning of wisdom, so I don’t worry about it, drink tea and think of myself as a wise man.

Who knows it might be true?

And since being wise is still compatible with being honest, I must confess that the title is not from me but from Ronald Coase, a British economist and writer.

All that glisters…

Following the guest post on my blog, I wanted to have a little more quantitative approach to the evolution of the American tea market.

So I looked for data from some sources and found something quite interesting at the Food and Agriculture Organisation (FAO): all the tea imports between 1986 and 2011 for 5 countries (Canada, France, Germany, UK, USA).

Why these countries? To compare things between countries that are perceived as similar in terms of consumption but not in terms of history and relationships to the tea.

I reworked the stats a little (for example starting in 1991 to get the same data from all these countries) and here are the first results.

041 - 5 countries

The USA imports more and more tea (43,000 tons more or over +50% in 21 years) whereas these tea imports drops in the United Kingdom (-13% but only a little over 23,000 tons less).

Even if their tea imports increased overtime, the 3 other countries I selected don’t play in the same league. With a little under 55,000 tons imported each year, Germany plays in the second league while with under 20,000 tons each year, Canada and France are obviously in the third one but all of them share something with the USA: the increase over the years ranging from +38% (France), +44% (Canada), +118% (Germany).

From this first analysis, we can conclude that the USA is a big tea importer and that if everything goes well for them, it could really soon beat their only rival, the United Kingdom.

The next question is what they make with all this tea.

And to know the answer (or a part of it), the question is where does all this tea comes from?

Below is a map that shows every country that exported tea to the USA even once between 1991 and 2011.

041 - US tea imports

Seeing some rather exotic countries in the list like Greenland or some other small one is the joy of statistics on international trade.

This problem coupled with the low frequency of some of these trades doesn’t help us a lot. So I decided to eliminate those who had traded for less than 10 years over the period 1991-2011.

041 - US tea imports 10 years

This map is a little more interesting but displays the countries where some companies are located or countries that re exported tea to the USA.

When focusing on those with an average export level of more than 1,000 tons per year, only a few countries are left with two kinds of countries: those re exporting what they brought (Great Britain and Germany) and those exporting directly.

041 - US tea imports 10000 tons

These 11 countries exported in 2011 118,260 tons to the USA with Argentina being the first (50,034 tons) followed by China (26,335 tons) and India (12,564 tons).

What can we deduce from these elements?

Probably something that you all know that in spite or because of their huge imports, people in the USA (as a whole) do not drink high quality tea (I read that Argentinian tea was mostly used for bags and iced teas).

This is not a scoop but I suspect that there is a trend under this for higher/more exotic teas that could really change the way tea is perceived/drunk.

This will probably the next step in my analysis: find some value statistics and try to link them to those I already collected so that I can get a complete overview.

France, its colonies and tea

I know it is probably quite strange to publish something about a country that is going to get under the ever cautious eyes of Mr @thedevotea himself and that @lahikmajoe wrote about.

What is even worst is knowing that in 2009, with a mere 0,21 kg per year and per capita, France ranked 88 in terms of tea consumption per capita and per year (along really known tea drinkers countries like Azerbaijan, Belize and Moldiva) (source: http://en.wikipedia.org/wiki/List_of_countries_by_tea_consumption_per_capita and the Food and Agriculture Organisation of the United Nations).

But we are talking about the country of Theodor, Palais des Thés, Mariage Frères, Kusmi Tea, Dammann Frères and so many others I forgot to name (and no this is not a ranking), so there must be something to it.

I did some research and found online a book published in 1912, L’agriculture pratique des pays chauds, a compilation of newspapers from the Bulletin du Jardin Colonial et des jardins d’essai des colonies françaises (Bulletin from the Colonial Garden and the French Tropical Botanical Gardens).

I think the best way to sum up this article is to say that some of the French colonies had potential but lacked both the cheap labour needed to harvest tea and the skilled one needed to prepare it.

The main producing area was Indochina but I will come back to it later.

In Senegal, there was no tea but a kind of ersatz, the Lippia adoensis, but the production was rather low.

Mayotte and Madagascar produced some tea (not much) but mostly in private gardens or through experiments with plants comings from Java or Ceylon.

The production in the second of these islands is said to have been of excellent quality but I don’t know how they judged it.

La Réunion must have shown great promises since tea production was introduced at least 4 times (1816, 1841, 1858 and 1894) from Java or Ceylon, mostly because the interest seems to have vanished because of the same reasons that seem to have plagued the French tea industry.

However, the quality was there since in 1867, tea from La Réunion earned the gold medal at the Paris Universal Exposition (the writer wrote the London one but it must be a mistake).

Now we are getting to Indochina, the tea jewel of the French Empire.

The local people produced a tea but it was badly prepared (at least for the European standards) and as such was not really interesting for the colonial power or the rich local people (who drank Chinese tea)

It seems that the missionaries were among the first to introduce tea production (mostly because no one ever thought of competing against the Chinese teas) in Assam from where it went in the whole country.

The different plantations belonged to French owners and the production was directly sold through them.

But all this for what?

Here is the tea consumption in France during these years.

As you will see it is not really that bright with a really low consumption per inhabitant and a stable price (rather typical of the period).


I would have liked to publish here some of the pictures that first inspired me but I asked for the authorization and didn’t receive it.

So I can only put the link here and hope you will click on it.

http://anom.archivesnationales.culture.gouv.fr/sdx/ulysse/index

After clicking on it, just write “thé” in the “Plein texte” box and then hit enter.

“Café du Commerce” and tea

Let’s start with what is called in French a “Café du Commerce” analysis (mostly a popular wisdom analysis that you can hear in most cafés): tea prices are too high.

You do agree, right? How many times did you hear that? Or perhaps even say it?

I once explained why the same teas sold by two different companies could be sold at different prices(Whats in a name?…Price) but this is not really the point made by popular wisdom here.

The point is more that the price of the commodity itself is high.

Since I begin to write this blog, this question of prices has been fascinating me. Why?

Because tea is for now still sold through auctions and is one of the last (if not the only one) commodities to be sold that way.

This means no futures (to be simple and unfair to what was supposed to be an insurance product about bad crops, let’s say that it is a way for the financial markets to speculate on the prices of commodities but if you want a more impartial definition, just follow the link Futures Contract) and therefore no speculations, only the good old supply and demand meeting each other and deciding for a price.

The perfect dream of any economist, no?

Don’t be afraid, I won’t try to find out if there is speculation on the prices of tea but I will try to find out if it is true that prices are high.

To do this, I needed data (yes, economists can live on a diet made mostly of statistics, data and figures but not without a drink, which for me is obviously tea) and I was lucky to find two online sources: one with the monthly prices (in US cents per kg) of the last 360 months (starting for me in November 1981) at the London and then at the Mombasa auctions (Monthly Commodity tea price from IndexMundi) and the other with the weekly average prices of tea at the weekly auctions of Sri Lanka, Indonesia, Kenya and Malawi from December 1999 to June 2002 (Dharmasena, Kalu Arachchillage Senarath Dhananjaya Bandara (2004). International black tea market integration and price discovery. Master’s thesis, Texas A&M University. Texas A&M University. Available electronically from International black tea market integration and price discovery)

Then I had to cross check the data to see if it was usable for me and the answer was that the first set of data was usable while the second wasn’t.

Why? Because according to the methodology from the author, he had to make some guesses and assumptions (that might be right but I wanted fully reliable data) and second because I had no easy way to know when these auctions were hold, making the second step of my analysis a lot harder to do.

So what does these sets of data look like?

To be as complete as possible, you will find below both of them (for the second one, I put everything at 100 in the first week so as to compare the evolutions of different prices labelled in different moneys) but I will only use and comment the first one.


Click to view


Click to view

You will all see that after a kind of bubble in 1983-1985 and another in 1997-1998, the price was moving around a central value of more or less 200 cents per kg and this until 2005 when it began to rise to reach a little over 350 cents per kg in November 2011, meaning a rise of 175% between 1981 and 2011.

Not bad?

So now, you will begin to wonder why did it rise like that? That is a good question but one I will not answer here as there are several plausible explanations and one set of data even over 30 years might not be enough to find the good one (or good ones).

The next thing you will begin to say is that the good old popular wisdom was right and that we are all sheep waiting to be sheared.

Since you know me a little by now, you can easily understand that the answer might not be as easy as it seems.

Why? I hear them (you know them, the guys sitting at “Le Café du Commerce”) say, “the data is here, you must recognise that we are right.”

I am sorry guys but there is still a little something I need to check before telling you that you are right or wrong.

What do I have in mind exactly? A simple thing : nominal vs. real values.

You are probably thinking this is another strange concept but it isn’t.

You all know that the value of money changes overtime or put it in another way, for 1$ today, you don’t buy the same amount of a given product than 20 years earlier.

You might argue it is just a trick to make things more complex but it has more to do with inflation than with tricks, ie prices go up and down each year following inflation or from time to time deflation, so 1$ of 1991 would be more or less worth 1.6$ of 2011 (I said more or less because I didn’t bother what should be written after the point).


Click to view

So, what do these new figures tell us?

We see that the same bubbles over the years but what is more important is that tea prices have decreased.

Yes, you read me right. In the last 30 years, the price of the auctioned tea has become cheaper in constant money.

You should feel lucky to live nowadays, shouldn’t you?

Of competitive intelligence, letters and tea

We live really interesting times.

Thanks to the Internet I can chat with people from all over the world about tea or any other topic I might be interested in.

I can also find a lot of surprises while looking for other things (which is probably my favourite part of the Internet) and I can also have access to a whole set of data and figures on tea trade, tea consumption, tea whatever you might think of.

Now, you are probably wondering if I have lost my mind somewhere over the rainbow or if the Mad Hatter took it to make one of his special teas.

The answer is none of the above.

When I read a book on trade or spying in the old times, I am always amazed by how they informed themselves about prices, products, competitors…

The whole process might surprise a few people that think that we (those of the modern era) invented everything but let’s look more closely at a modern concept: competitive intelligence.

What is it?

According to Wikipedia, “a broad definition of competitive intelligence is the action of defining, gathering, analyzing, and distributing intelligence about products, customers, competitors and any aspect of the environment needed to support executives and managers in making strategic decisions for an organization.”

Now, let’s go for a few lines in the mind of one of the tea merchants from earlier and see if this definition would fit.

Let’s say you belong to a big company, perhaps the East India Company and you want to know if you can still sell tea, how, to whom and at what price (you know that you want to sell tea, don’t you?).

Surprise, you just defined your intelligence needs about your customers, competitions, needs that will allow you or more likely the board of directors to decide what is the best sales strategy for tea.

The next step is to decide who are the people able to answer your questions.

First, accountants to let you know how much it costs, where you make a profit, how much tea you sale each year and other mundane things.

But then, comes the tricky questions regarding competitors, foreign markets.

What do you do?

Today, you would probably look all over the Internet for raw data, chat with people for qualitative information, give a few phone calls, look at the press… But apart from the press, none of these tools were available during the time of the East India Company.

So the only option would be to take your most beautiful feather and write letters (or make others write them after all you are the boss here) to selected consuls and gentlemen to ask them to collect data on the local/national market (depending if there is a thing like a centralised state or if it is more a balkanised one).

You would probably ask the same questions to several people so as to be able to double or triple check their answers (you never know).

Now, gathering and analysis are likely to be done (it was not done as quickly or easily as I might make it sound but still) and this is when distribution of the collected and analysed data would be useful.

If you were in the Middle Ages, you would probably write it down in some obscure language but now in the 19th century, you are civilized, so you probably print it since His Majesty ordered the East India Company to do so.

And guess what? Years later, the Bayerische StaatsBibliothek made a copy of it and put it on the Internet, so enjoy the Papers relating to the trade with India and China including information and prices of tea, in foreign countries.

To help you to read through it, I gathered every tea related information I could find in this book and put it under Google Docs (file here)

Just to show you how serious these people (you know them, they are you) were with tea and competitive intelligence, I must tell you that each file has something like 18 tabs filled with data.

Transformed in Germany, a new paradigm for German tea?

I had a few discussions and mail exchanges with @Lahikmajoe about the German tea culture and its importance mostly in Northern Germany.

According to him, one of the reasons behind it is that this area is the hinterland of the port of Hamburg.

This was coherent with other things I had read about the importance of Hamburg for the importations of coffee in the whole Europe.

So I decided to try to find a little more information on this and asked the Port of Hamburg Authority about this.

I must say that their staff was really friendly and sent me quickly some data.

According to the German Tea Association, 76.778 tons of tea were handled in Germany.

This figure includes the 50.838 tonnes imported of which about half (25.940 tonnes) were re-exported (probably after some blending and/or repackaging).

About 75% of these tonnages went through the Port of Hamburg, making of it according to the Port of Hamburg Authority the most important European hub for tea trade.

However what I found most fascinating is the data provided to them by the German Tea Association regarding imports and re exports.

When you look at them, you can see two interesting changes over time:

  • the sudden increase from 1988 on of the imported tonnages,

  • the rise of re-exportation (a little over 50% of the imported tonnes in 2010).

This prompted me to look at the few figures I have one more time and to drop the re-exportations to see what is really consumed in Germany.


Now, we have a completely different picture.

The 1988 increase is still there but after that, it seems that the importations are more or less flat (in terms of tonnage, value being another interesting indicator to look at).

Is Germany a country famous for its teas? Perhaps or the reason could be different as I read in my Tea Lover’s Guide that Hamburg is home to a certain number of large tea brokers that supply almost all the European “importers” of a certain standing but the problem is that the figures don’t really support that.

For now, the set of data I have is not huge enough to allow me to go further into that direction but my next task is to gather more data and to see with the German Tea Association if they have any ideas on the reasons behind these figures .

So far, I didn’t receive any answer from them but I won’t let them run away with it.

After all, I have all the time in the world as long as I have my tea cup near me.

A lot of data but no definitive answers

All the data used in this article were found in the 2010 Tea Barometer of the Tropical Commodity Coalition for sustainable Tea, Coffee, Cocoa and are stated as being 2008 data.

The most obvious information is that there is a split in the producing countries between those favouring home consumption and those favouring exportation: China and India are both countries that drink more than 70% of the tea they produce while Kenya and Sri Lanka export 95% of the produced tea.

The explanation behind it seems quite logical as China and India have a long tradition of drinking tea whereas in the other two countries, it was only introduced to sell to a foreign market.


For auction and direct selling, Chinese teas are all sold directly while most of those coming from Kenya and Sri Lanka are sold via the classical auctions (see what happened in Europe when tea drinking became a must). India is in a third category as its production is sold nearly equally through auctions and direct selling.

When I tried to understand why it works like that, 3 reasons came to my mind.

The first and most obvious one is that these differences could be explained by the introduction of tea in a country “only” in order to supply a colonial power with the use of the sales techniques and infrastructures that keep on being used even when the country becomes independent .

Another plausible explanation was that the higher the quality, the higher the percentage of direct sales or the lower the production, the more the auction system is being used. However, this is not consistent with the facts as Sri Lanka has the lowest direct sales percentage but probably not the lowest quality and the difference in raw production with Kenya is not enough to explain this loss of direct bargaining power.

A third idea was that the countries with more tonnage sold were also the ones most heavily involved in auctions but again China with its “low” level of exportations goes against this rule.

Of these 3 explanations, only the first one is coherent with the 4 countries but the question would then be: why did the situation remain the same?


The smallholders/estates production split would seem to be linked to the timeframe and men behind the introduction of the tea culture (cf. the introduction of tea in Sri Lanka and how smallholders were crushed) but the facts don’t support this theory since only India has a really high percentage of its tea production coming from estates (more than 70%).

Another explanation could be that the countries producing tea in estates do sell teas strongly linked to the places they are in (a bit like terroir in wine) but the Chinese example with its 80% of its tea production coming from smallholders is an example that doesn’t support this theory.


Perhaps the reason lies in the workforce but even if in India, you need less men to produce one ton of tea than in the three other countries, the difference between Kenya and Sri Lanka shows that this explanation is not the good one either.

So in the end, what can we learn from this set of data? Several things but more importantly that nothing is as easy as it seems and that more work is needed to understand the tea industry.

If you have information or insights on how it works, please feel free to comment.